Leveraging MongoDB Atlas, Kafka Confluent Cloud, and Databricks to Perform Reddit and StackOverflow Posts Sentiment Analysis — Part 2
Welcome back to the next phase of enhancing our sentiment analysis project. In the first part of this series, I introduced a simplistic version of the project where I calculated the sentiment of Reddit posts focusing on MongoDB, laying the groundwork for what I’m about to dig into.
Now, in this second part, I will be focusing on near real-time analysis! I’m also widening our data sources to incorporate posts from Reddit and StackOverflow, thanks to the integration of Kafka Confluent Cloud into the technology stack. This means we can process and analyze posts from Reddit and StackOverflow as they go live, giving us the most up-to-date sentiment data available.
Here are the main objectives for this phase of the project:
Real-time data extraction and processing leveraging Kafka Confluent Cloud.
Expanded data sources by adding StackOverflow posts.
Continuous sentiment analysis.
Real-time visual insight generation using MongoDB Atlas Charts.
Throughout this blog post, I’ll walk you through my journey of managing this process — from the approach I took to the obstacles I faced.
High-Level Architecture
The high-level architecture of our solution is built around several key technologies, each serving a critical role in the overall process:
StackOverflow API & Reddit API: These APIs are my primary data sources, providing me with a constant stream of user posts from StackOverflow and Reddit, respectively.
Kafka Confluent Cloud: This serves as our real-time event streaming platform, allowing us to process data nearly as soon as it is posted.
MongoDB Atlas: This hosted/managed MongoDB database cluster stores the data we extract from StackOverflow and Reddit, making it easily retrievable for analysis.
Databricks: This platform is where we perform our sentiment analysis, transforming raw data into meaningful insights.
Textblob: Within Databricks, I utilize Textblob, a Python library pre-trained model, to analyze text for sentiment.
MongoDB Atlas Charts: After analysis, we implement this component of the MongoDB Atlas platform to visualize sentiment scores, allowing us to interpret and share the findings easily.
A Deeper Look into the Key Technologies
To ensure a smooth transition, I have retained the existing technologies used in part 1 of this journey. Here’s a recap of their functionalities:
MongoDB Atlas and Time Series Collections
MongoDB Atlas is an essential part of my technology stack, facilitating efficient data management with its Time Series collections. It is a hosted, managed MongoDB database cluster with robust capabilities for storing a wide array of data types. Leveraging its Time Series collections, I can efficiently handle and organize data based on their time of creation, which is particularly useful when dealing with large volumes of time series data.
Databricks and Textblob
Databricks is the platform where I perform my sentiment analysis, transforming raw data into valuable insights. It is a unified analytics platform that simplifies the process of managing and organizing large volumes of data. Within Databricks, I use Textblob, a simple API for a variety of natural language processing (NLP) tasks, including part-of-speech tagging, noun phrase extraction, and sentiment analysis. Textblob allows me to analyze the sentiments expressed in text data, providing me with a means to quantify and categorize sentiments without having to train a model from scratch.
MongoDB Atlas Charts
MongoDB Atlas Charts is another key component of my technology stack. It is part of the MongoDB Atlas platform and is used to visualize sentiment scores. The use of MongoDB Atlas Charts simplifies the interpretation and sharing of my findings, as it allows me to translate complex data points into easy-to-understand visual representations.
Kafka Confluent Cloud
As part of my effort to enhance the capabilities of my stack, I’ve introduced Kafka Confluent Cloud. Kafka Confluent Cloud facilitates near-instantaneous processing and consumption of data, managing high-volume data streams from APIs such as StackOverflow and Reddit. It comes equipped with a comprehensive suite of features that allow me to manage these data streams effectively.
MongoDB Atlas Kafka Connector
Alongside the Kafka Confluent Cloud, I’ve also incorporated the MongoDB Atlas Kafka Connector into my stack. It bridges my Kafka Confluent Cloud and the MongoDB Atlas database cluster, ensuring smooth data flow. This connector allows me to store the incoming data from StackOverflow and Reddit efficiently in my MongoDB Atlas database, making it easily retrievable for analysis.
Building the Sentiment Analysis Solution
Creating this near real-time sentiment analysis solution was a step-by-step process involving five main stages:
Data Extraction: My journey began with setting up API listeners for my new data sources — StackOverflow and Reddit. Configured within the Kafka Confluent Cloud, these listeners continuously monitor for new posts and comments, extracting relevant data as it’s generated.
Data Processing: Once received from the APIs, the raw data is processed in near real-time via my Kafka Confluent Cloud. This stage involves cleaning the data, extracting key information, and preparing it for further analysis.
Data Storage: Utilizing the MongoDB Atlas Kafka Connector, the processed data is then stored in my MongoDB Atlas database cluster. This setup ensures that I have a centralized, efficient storage system for quick and easy data retrieval.
Sentiment Analysis: Next, the stored posts are analyzed using Databricks and TextBlob library. This categorizes each post as positive, negative, or neutral based on the sentiments expressed within.
Data Visualization: In the final step, I visually represent my sentiment analysis results using MongoDB Atlas Charts. These visualizations simplify the interpretation of my findings and facilitate easier sharing with others.
Now that I have an overview of the five main stages involved let’s explore each step in more detail. The detailed steps to build this solution can be found on this git repository.
Step 1: Setting Up Kafka Confluent Cloud
My first action was to set up Kafka Confluent Cloud and create a new cluster. This process involved initializing the cloud service. Once that was done, I moved on to the creation of a new cluster, which provided the foundation for real-time data streams. You can find the exact steps on how to set up Kafka Confluent Cloud in this git repository.
Step 2: Crafting Producers for Reddit and StackOverflow Posts
Next on my list was to establish producers for Reddit and StackOverflow posts. Using Java to interact with the APIs of both platforms, I was able to send post data directly to Kafka Confluent Cloud. The StackOverflow API, in particular, was quite straightforward to work with. It required less configuration than the Reddit API, which was a pleasant surprise. This difference made the initial setup easier and allowed me to focus more on refining the data processing capabilities of this project.
Step 3: Creating and Configuring a Kafka Connector to MongoDB Atlas
After configuring the producers, the next step was to create and configure a Kafka Connector specifically tailored for time-series collections in MongoDB. This involved using the Kafka Confluent Cloud dashboard to set up the connector and ensure proper configuration. To accommodate MongoDB’s time-series collections, it was essential to configure the connector with the correct timefield and write strategy. In my case, I personally used the “insert one” strategy to optimize data ingestion. You can find more details on how to configure MongoDB Kafka Connector Sink in this blog.
Step 4: Modifying the Databricks Script for Near Real-Time Operations
I revised the existing Databricks notebook to fetch and analyze the posts from MongoDB Atlas in near-real-time. This modification was needed to ensure our sentiment analysis tool operated in near real-time for more immediate results. The full updated code can be found in this git repository.
Step 5: Configuring MongoDB Atlas Charts for Visualization
Finally, I configured MongoDB Atlas Charts to visualize the sentiment analysis data in near real-time. This adjustment to our visualization tools provided an immediate, visually appealing, and understandable view of our data.
Results and Visualizations
By utilizing MongoDB Atlas Charts, I was able to gain valuable insights into the evolving sentiments towards MongoDB on platforms like Reddit and StackOverflow. Below, you’ll find a few charts that I created based on the posts hosted on MongoDB and analyzed using Databricks.
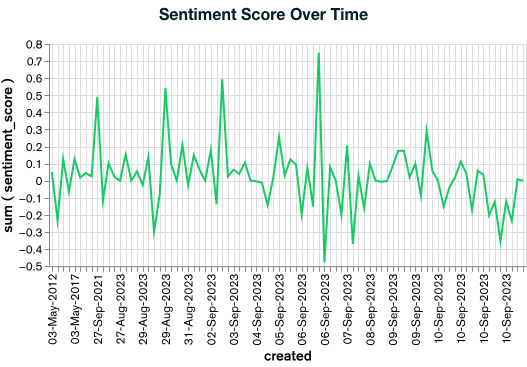
Sentiment Score Over Time
The first chart shows the overall sentiment score over time, calculated using our sentiment analysis tool. This chart provides a broad view of the sentiment changes towards MongoDB. In this git repository, you can find the steps to build the same chart.
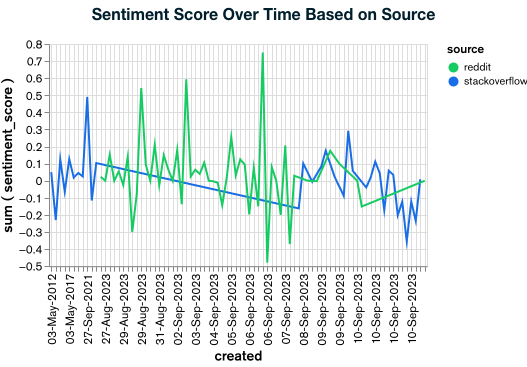
Sentiment Score by Source
To grasp the difference in sentiments between different platforms, I have a chart showing sentiment scores by source. This chart brings together the sentiment scores between Reddit and StackOverflow, providing insights into how MongoDB is perceived on different platforms.
Sentiment Comparison of Reddit Scores VS Calculated
Based on feedback from my previous blog, where there was interest in exploring the correlation between Reddit post scores and sentiment scores, I decided to give it a try. Using a scatter plot chart, I analyzed the relationship between these metrics. The sentiment analysis scores range from -1 to 1, and to account for the varying scale of Reddit post scores, I applied a logarithmic function using MongoDB Atlas Charts. The chart revealed that sentiment scores tend to be above neutral, indicating a trend toward positive sentiment in the discussions analyzed. Interestingly, the popularity of a Reddit post, as indicated by its score, does not consistently predict the sentiment expressed within it. This highlights the importance for companies to look beyond surface metrics and understand community sentiment more deeply.
Conclusion
In conclusion, the integration of Kafka Confluent Cloud into our technology stack has allowed us to elevate our sentiment analysis tool to new heights, giving it real-time capabilities. By processing and analyzing data from platforms like Reddit and StackOverflow almost instantaneously, we’re now able to offer invaluable insights into customer sentiment as it unfolds. Companies like MongoDB can leverage this to react swiftly to customer reactions, addressing concerns or capitalizing on positive sentiment in near real-time.
In summary, this deep dive into sentiment analysis showcases the influence of machine learning on real-time data interpretation. What innovative applications do you see in your own projects? Stay tuned and follow me for more insights into the evolving realm of machine learning, data analysis and cloud technology!


